clawtop
htop for OpenClaw. See where your gateway's memory goes, per agent run; stop the runaway ones safely; keep your sessions tidy.
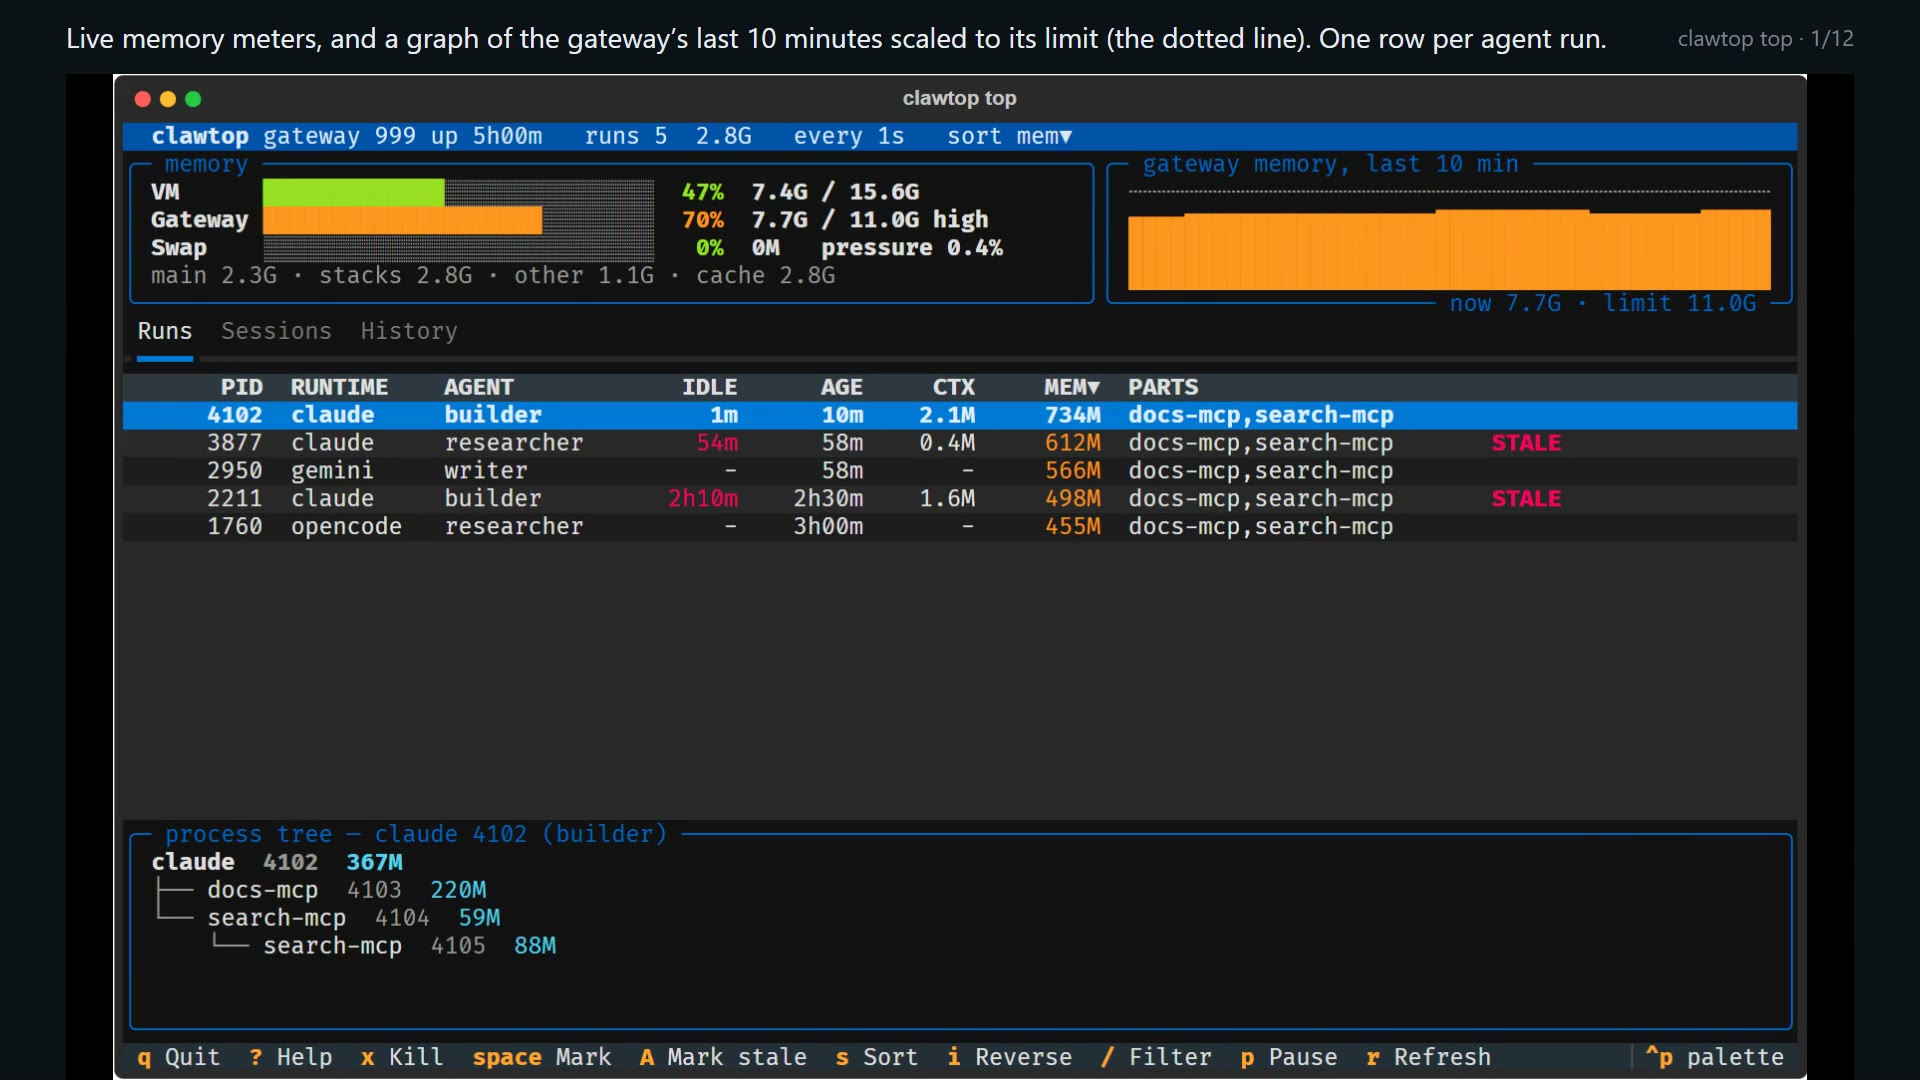
A walkthrough video (1:38, sample data) is on the walkthrough page.
The problem
Many OpenClaw runtimes (CLI backends such as Claude CLI or Gemini CLI, and ACP harnesses) start a separate process for every agent run, plus the MCP servers and helpers that run uses. In the author's setup each such stack is roughly 0.5 to 0.7 GB. A burst of runs, or a few that hang on a tool call, can push the gateway past the VM's RAM. The event loop then stalls in swap and restarts fail.
clawtop makes that visible and fixable in one command.
What you get
- Memory per run, measured so the numbers add up to the gateway's cgroup total.
- Real idleness where the runtime exposes it (Claude Code's transcript today), so a busy long-lived run is not flagged and a stuck one is. Never guessed from age.
- Any runtime that runs as a process: runs are recognised by structure, not by program name.
- Safe kills of whole stacks. Only processes the gateway spawned can be selected.
- Sessions listed, shown as a tree with subagents under their parent, and archived or pruned.
- History: a per-minute sampler and a sparkline of what a memory spike looked like.
- Works from Windows: the command forwards into your WSL distro.
Where next
| I want to... | Go to |
|---|---|
| Install it | Install |
| See it in action | Walkthrough video |
| Watch it live, like htop | Interactive view |
| Find what is using memory | Watch memory |
| Free memory right now | Stop runaway runs |
| Close old sessions | Manage sessions |
| Stop it happening again | Harden the gateway |
| Understand the terms | Concepts |
| Look up an option | CLI reference |