Interactive view: clawtop top
A live, keyboard-driven screen in the spirit of htop and bottom: the gateway's memory, every agent run, your sessions and the memory history, all in one terminal.
Note
top needs a real terminal. In scripts and pipes use clawtop status --json.
On Windows it forwards into WSL like every other command.
The screen
Top bar. Gateway PID and uptime, how many runs and how much memory they hold, the refresh interval, the current sort and filter, and how many rows are marked.
Memory. Bars for the VM, the gateway cgroup (against its MemoryHigh limit) and swap, then the
split between main process, run stacks, other helpers and reclaimable page cache.
Graph. The gateway's memory over the last 10 minutes, newest on the right. It is scaled from zero up to the limit, so a steady line looks steady and a climb towards the dotted limit line is obvious. It starts from the sampler log if you have installed the sampler, so it is not empty at startup.
Tabs. Switch with 1, 2, 3, or click a tab.
Runs
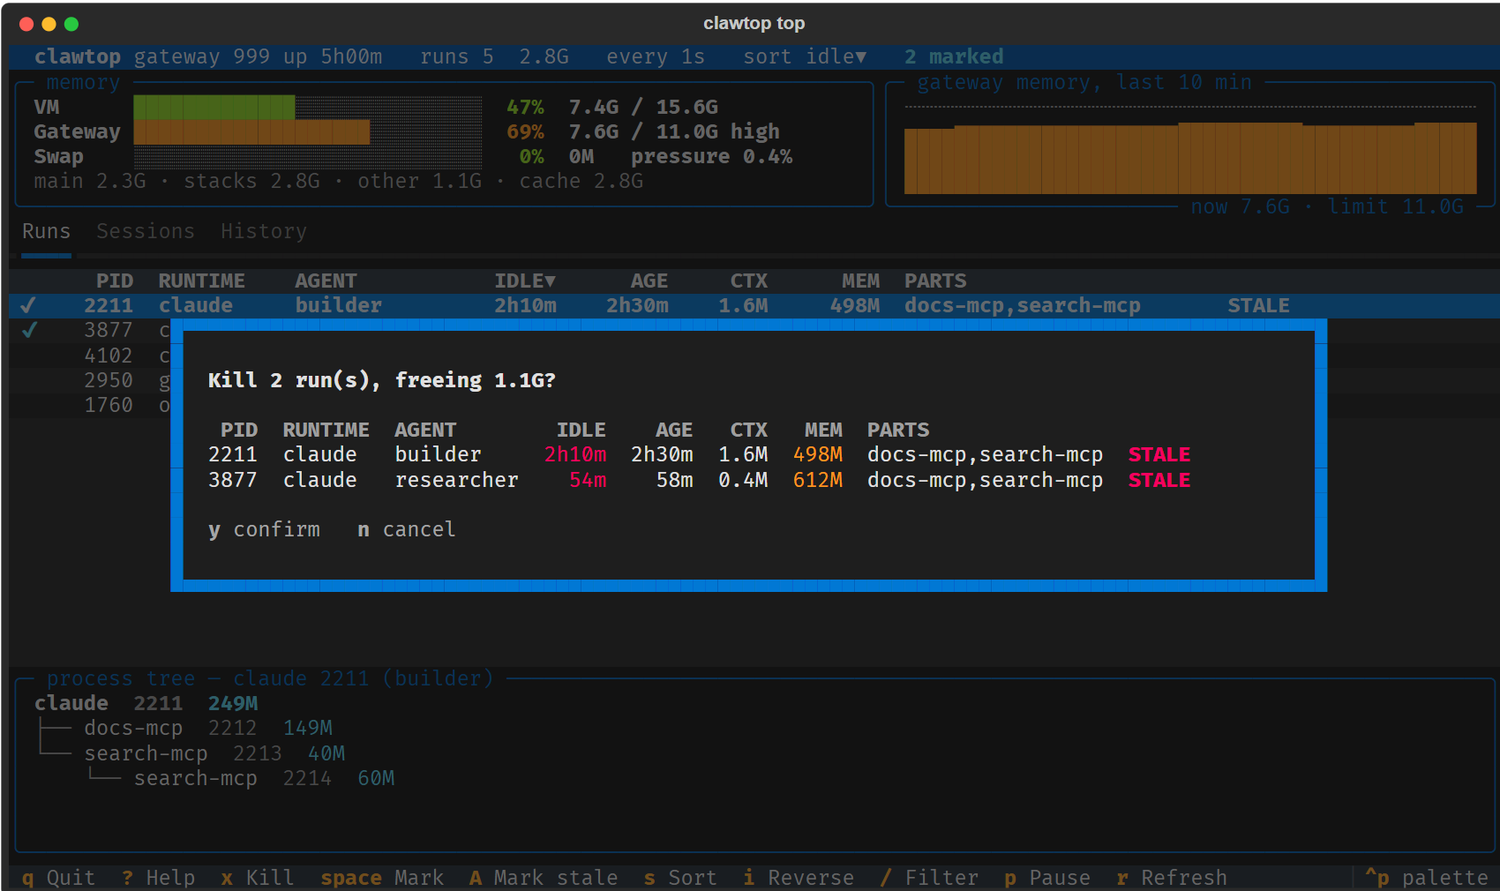
One row per agent run, with the same columns as clawtop status (see Concepts).
Below the table, a process tree shows the highlighted run and every helper it started, with each
process's memory.
| Key | Action |
|---|---|
↑ ↓, j k |
Move |
space |
Mark or unmark the row (and move down) |
A |
Mark every STALE or ORPHAN run; press again to clear |
x, F9 |
Kill the marked runs, or the highlighted one if none are marked. Asks first |
s |
Next sort key: memory, idle, age, PID, agent, runtime |
i |
Reverse the sort. Clicking a column header also sorts by it |
/ |
Filter. Type words; a run must match all of them (runtime, agent, PID, helper names). Enter keeps the filter, Esc clears it |
The cursor follows the run, not the row number, so it stays on the same run when a refresh reorders the table. Runs with unknown idle time sort last when sorting by idle.
Killing works exactly as in Stop runaway runs: the confirmation lists every run that will be stopped and the memory it frees, and it only ever acts on processes the gateway started.
Sessions
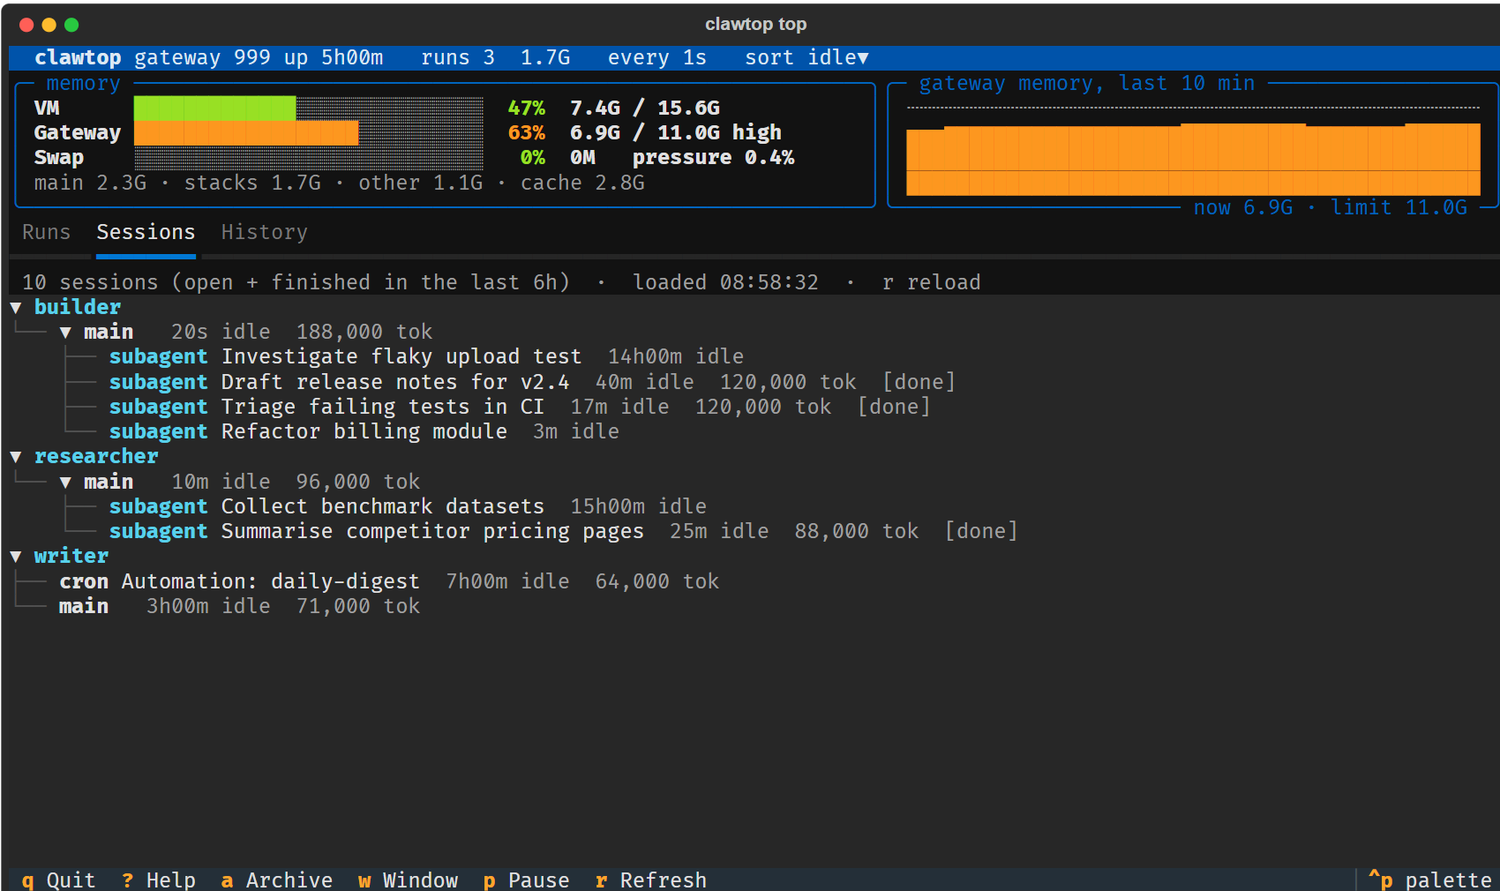
The same tree as clawtop sessions tree: one group per agent, subagents nested
under the session that spawned them, with titles. It loads from openclaw when you open the tab (a few
seconds on a busy gateway) and on r.
| Key | Action |
|---|---|
↑ ↓, j k |
Move |
Enter, Space |
Expand or collapse the highlighted group |
a |
Archive the highlighted session (asks first). Finished sessions are left alone |
w |
Cycle how many hours of finished sessions to show: open only, 6 h, 24 h |
r |
Reload |
History
The memory history chart for the last 1 h, 6 h, 24 h or 7 d (h cycles), with
the runs that were alive at the peak. It needs the sampler; without it the tab says so.
Everywhere
| Key | Action |
|---|---|
p |
Pause or resume refreshing (the title bar shows PAUSED) |
r |
Refresh now |
+ - |
Refresh faster or slower (0.5 s to 30 s) |
? |
Show the key list |
q |
Quit |
Ctrl+P |
Textual's command palette (themes and other app-wide commands) |
The footer lists only the keys that apply to the tab you are on.
Try it without a gateway
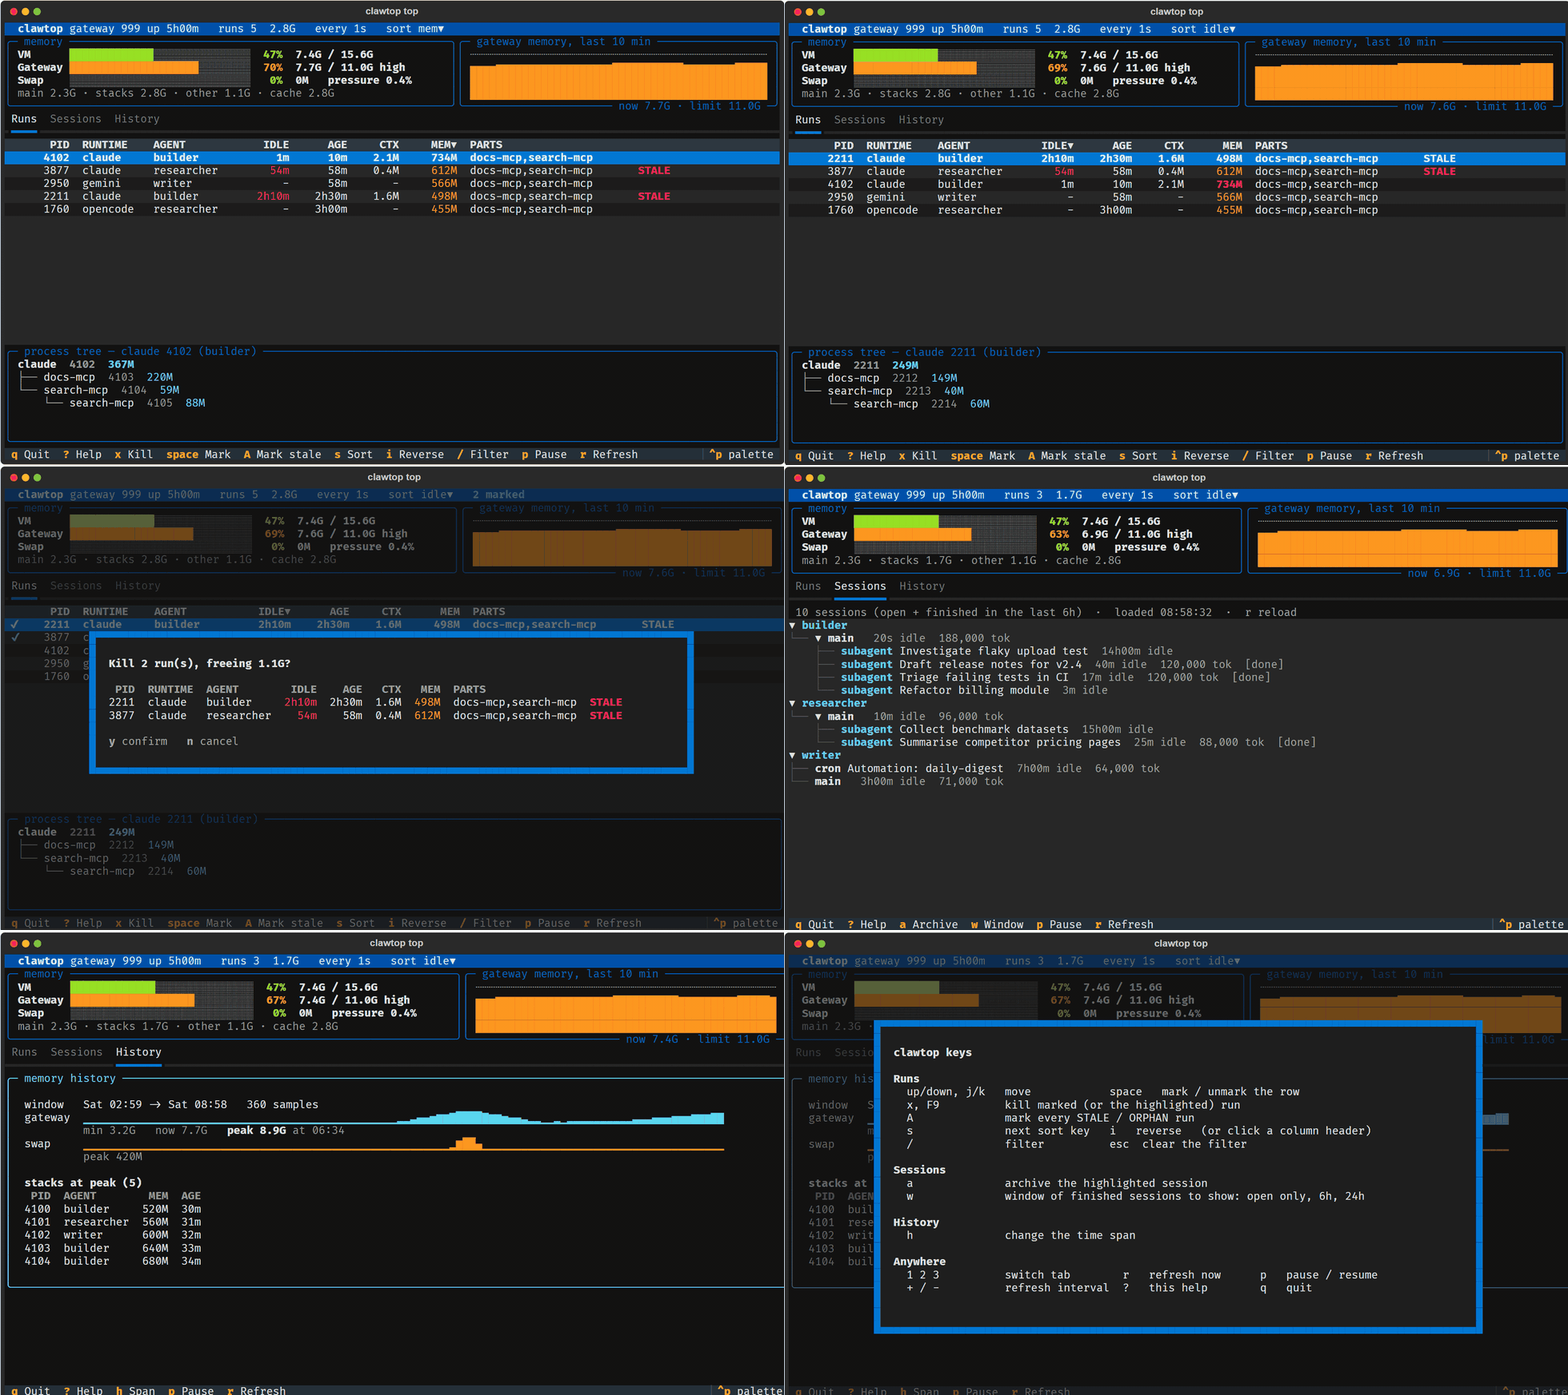
scripts/demo.py top runs this exact screen on made-up data, with kills and archives simulated:
Notes
- Colour. If
NO_COLORis set in your environment the screen is monochrome by design. - Refresh cost. Each refresh reads
/procfor your user's processes, a few milliseconds. Session data is only loaded while you are on the Sessions tab. - Unknown runtimes. A run whose runtime has no activity source shows
-for idle time and is never flaggedSTALE; use the age and memory columns to decide.